« PREVIOUS ENTRY
3D Windows
NEXT ENTRY »
Burning Man, from above

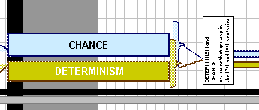
My friend Erik Weissengruber runs the superb blog Roll The Bones, which is devoted to his explorations of ludology — the theory of play. A while ago, Erik started designing “concept maps” that graphically illustrate various concepts of gaming. My personal favorite is the enormous, sprawling timeline he created that tracks the development of various theories of chance and luck, as they’re represented in science, philosophy, history, drama, and other arts. The timeline begins in 4000 B.C. (!!) and goes up to 1999 — and includes a zillion swooping arrows showing how ludology developed.
It’s utterly gorgeous and mindbending. It’s kind of like looking inside Erik’s brain, which is an extremely interesting and weird place to be. You can go to his site and download it as an Excel file to read or print up. I visited Erik in Toronto last week, and he gave me the poster-size version, so be warned: This sucker is over six feet tall and two feet wide, and even at those dimensions, it’s so crammed with information that the base font size is only eight points. Hang the history of probability on your wall!
I'm Clive Thompson, the author of Smarter Than You Think: How Technology is Changing Our Minds for the Better (Penguin Press). You can order the book now at Amazon, Barnes and Noble, Powells, Indiebound, or through your local bookstore! I'm also a contributing writer for the New York Times Magazine and a columnist for Wired magazine. Email is here or ping me via the antiquated form of AOL IM (pomeranian99).

ECHO
Erik Weissengruber
Vespaboy
Terri Senft
Tom Igoe
El Rey Del Art
Morgan Noel
Maura Johnston
Cori Eckert
Heather Gold
Andrew Hearst
Chris Allbritton
Bret Dawson
Michele Tepper
Sharyn November
Gail Jaitin
Barnaby Marshall
Frankly, I'd Rather Not
The Shifted Librarian
Ryan Bigge
Nick Denton
Howard Sherman's Nuggets
Serial Deviant
Ellen McDermott
Jeff Liu
Marc Kelsey
Chris Shieh
Iron Monkey
Diversions
Rob Toole
Donut Rock City
Ross Judson
Idle Words
J-Walk Blog
The Antic Muse
Tribblescape
Little Things
Jeff Heer
Abstract Dynamics
Snark Market
Plastic Bag
Sensory Impact
Incoming Signals
MemeFirst
MemoryCard
Majikthise
Ludonauts
Boing Boing
Slashdot
Atrios
Smart Mobs
Plastic
Ludology.org
The Feature
Gizmodo
game girl
Mindjack
Techdirt Wireless News
Corante Gaming blog
Corante Social Software blog
ECHO
SciTech Daily
Arts and Letters Daily
Textually.org
BlogPulse
Robots.net
Alan Reiter's Wireless Data Weblog
Brad DeLong
Viral Marketing Blog
Gameblogs
Slashdot Games